|
| For a Better Tunghai |
|
| For a Better Tunghai |
Comparing the latest market drawdown to previous routs
近期股市的回檔與過去股災的比較
by Charles Cheng, CFA
鄭又銓, CFA
Equity market turmoil continued into December, with the MSCI All Country World Index (ACWI) falling an additional -10.9% by December 24th. However, economic indicators still point to expansion, with the US Federal Reserve still seeing a robust enough economy to hike interest rates an additional 25 basis points on December 20th. With significant market drops usually comes investor indecision and uncertainty about what is going to happen next both in markets and the world economy. In these situations, it is often helpful to take a historical view of the current correction to obtain some context versus previous market drops.
股市動盪持續至12月,MSCI全體國家世界指數(ACWI)12月24日前又下跌了10.9%。然而,經濟指標仍指向擴張,美國聯邦儲備委員會由於仍然看到強勁的經濟動力,在12月20日上再加息25個基點。隨著市場大幅下跌,投資者會變得猶豫不決以及不確定市場和世界經濟接下來會發生什麼。在這些情況下,如果採用歷史的視角,來比較當前的和過往的市場修正來理解當前的情況,通常是很有幫助的。
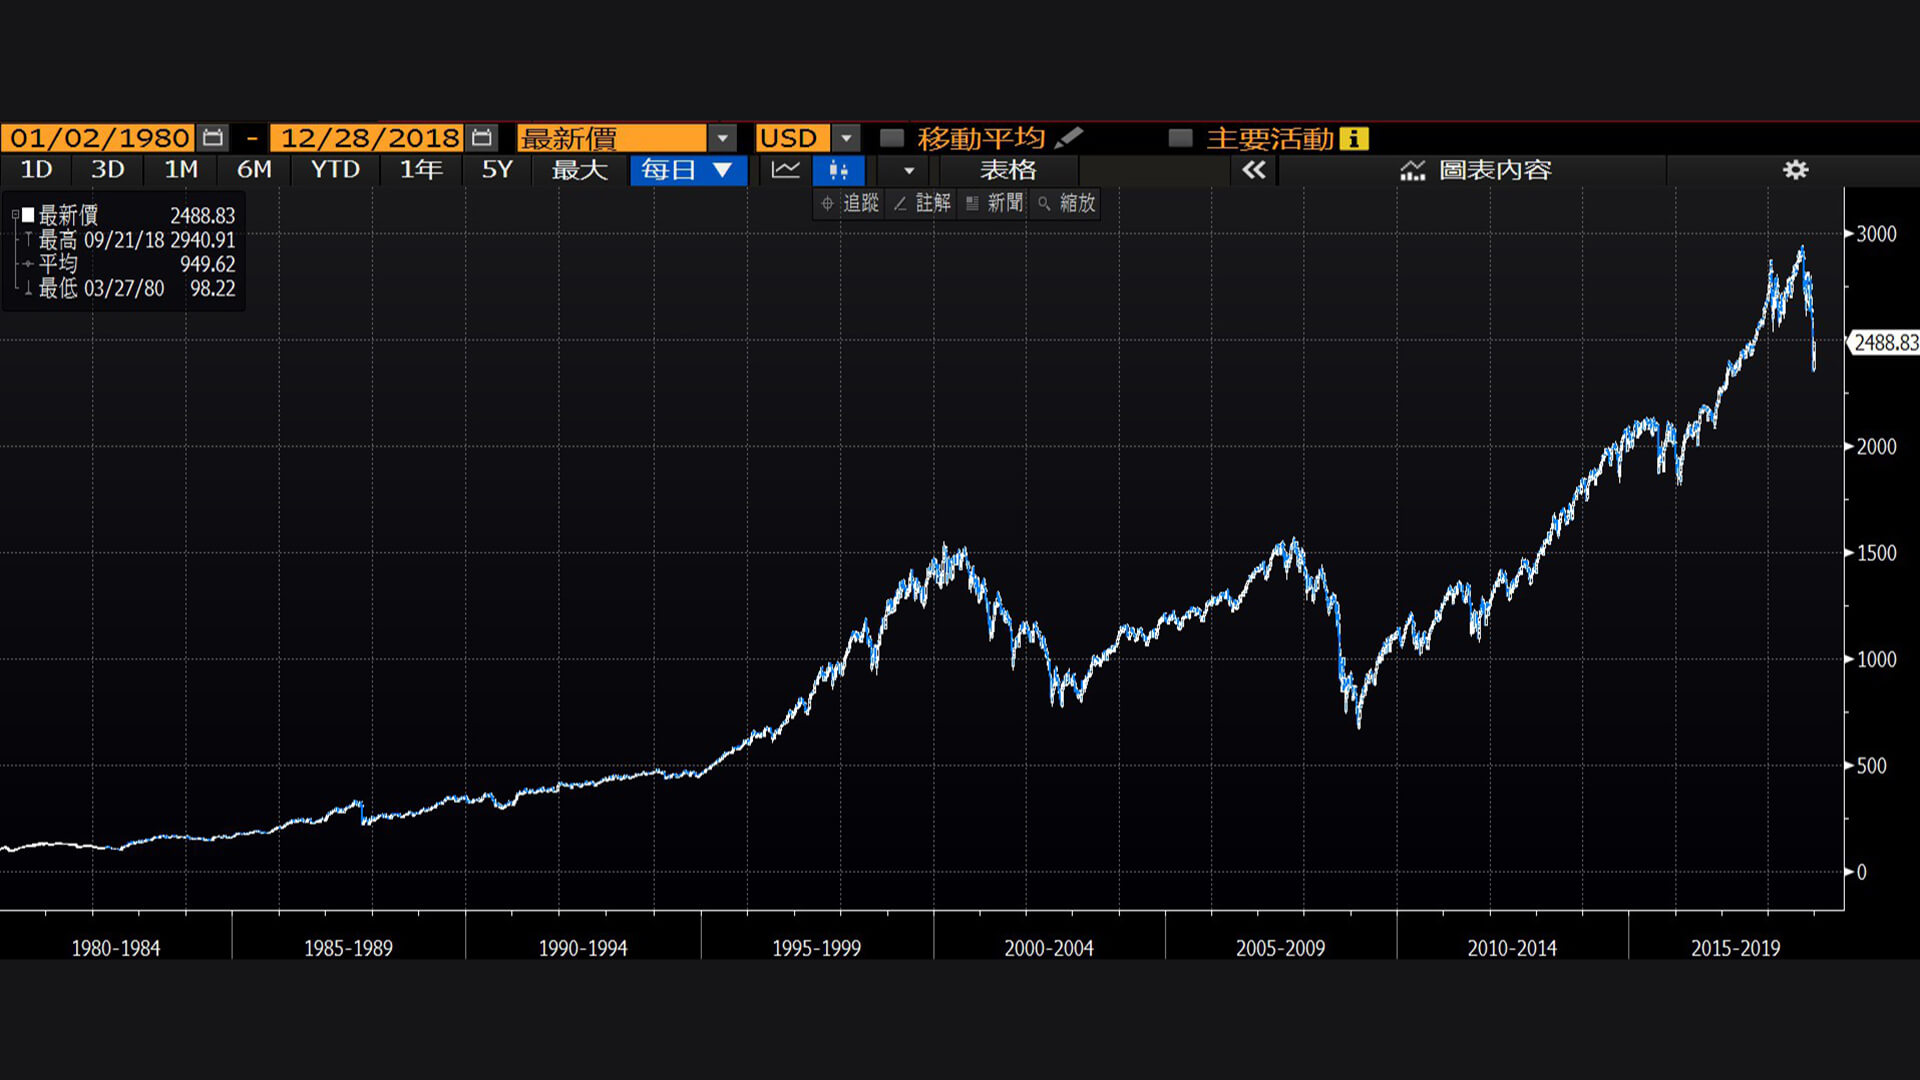
The center of the recent market drop has been the important US equity market, lead by the US, with the S&P 500 index down -14.8% month to date. The US comprises over half of the MSCI ACWI and has been the leading driver of its returns over the past decade. US equities peaked on September 20th, 2018. Since then the S&P 500 has lost -19.4%. Over the past 40 years, the index has had ten drawdowns of over -15% (below).
近期市場下跌的中心一直是由美國牽頭的美國股市;而標準普爾500指數本月迄今已下跌14.8%。美國股票占MSCI ACWI指數的一半以上,並且在過去十年中一直是其回報的主要驅動力。美國股市於2018年9月20日達到峰值。此後,標準普爾500指數下跌了19.4%。在過去40年中,該指數已經有十次跌幅超過15%(下圖)。
|
% loss |
Calendar days |
|
|
2/13/1980 |
-17.1 |
43 |
|
11/28/1980 |
-27.1 |
622 |
|
8/25/1987 |
-33.5 |
101 |
|
7/16/1990 |
-19.9 |
45 |
|
7/17/1998 |
-19.3 |
45 |
|
3/24/2000 |
-49.1 |
929 |
|
10/9/2007 |
-56.8 |
517 |
|
4/23/2010 |
-16.0 |
70 |
|
4/29/2011 |
-19.4 |
157 |
|
9/20/2018 |
-19.4 |
95 |
Source: Bloomberg
來源:彭博
On average, the losses were -27.8%, with the drops lasting 262 calendar days. However, there were large variations within these statistics, with losses ranging from -16% to -57% and durations lasting from 43 days to 929 days. After these corrections were finished, the Index rose an average of 35% in the year following the market trough.
總結上述的數據,平均而言,跌幅為-27.8%,下跌持續262個日曆日。然而,這些統計數據間是存在很大差異的,跌幅的範圍為16%至57%,持續時間為43天至929天。通常在這些修正結束後,指數會在市場低谷後的一年中平均上漲35%。
Four of the ten market drops corresponded to recessions in 1981, 1990, 2001, and 2008. These falls tended to be much longer and severe, averaging -42% and lasting around 542 days from peak to trough. However, most of these falls did not have a corresponding economic recession, and the damage to investors was more limited. Excluding the current correction, the falls without corresponding recessions averaged just -19% and lasted around 76 days.
上述10次市場下跌中有四次與1981年,1990年,2001年和2008年的經濟衰退期相對應。而這些情況下的下跌週期往往更長及更嚴重,平均為42%,從峰值到低谷持續約542天。然而,大部分市場修正下跌期都沒有相應的經濟衰退,對投資者的損害更為有限。(不計當前的修正),沒有相應衰退期的下挫,其跌幅平均只有19%,持續76天左右。
Whether what we are going to see continued pain in the markets likely depends on whether markets are accurately predicting an economic downtown. As the data does not yet clearly show one occurring, it is still too early to know what the outcome will be. The good news is that regardless of what has happened in recent downturns, investors who have stayed invested in the markets have eventually been rewarded.
無論接下來會發生什麼,市場的下跌很有可能取決於市場能否準確地預測經濟下挫。由於目前數據尚未明確顯示有經濟下挫的跡象,現在要論結果如何還為時尚早。好消息是,無論在近期經濟低迷時期發生了什麼,持續保持投資的投資者們最終都獲得了正回報。
Mr. Cheng is a managing partner at a Hong Kong based independent private investment office. This article reflects his personal views and not his firm’s and should not be viewed as an investment recommendation.
鄭先生為可承資本,一家總部設於香港的獨立投資辦公室之董事合夥人。這篇文章反映了他的個人而非公司觀點。該文章不應被視為投資建議。
● 讀後留言使用指南

|
近期迴響