|
| For a Better Tunghai |
|
| For a Better Tunghai |

Have we seen this before?
我們遇過這樣的市場嗎?
by Charles Cheng, CFA – Clarity Investment Partners
鄭又銓, CFA -可承資本
It has been a rough start to the New Year in the financial markets with plenty of things to worry about around the world:
– The world stock market index is down over -8% as of January 20th. As global markets tend to move together, the markets of most countries are down. If this performance stays the same or lower by the end of the month, it will have been one of the worst months in the past 50 years
– The US Federal reserve has begun the first in a series of expected rate hikes
– Many currencies around the world are falling rapidly against the US dollar.
新年伊始,金融市場就經歷了艱難的開端,全球範圍內都有許多令人擔憂的問題:
-截止至1月20日,全球股票指數下跌逾8%。由於全球股市的走向趨於一致,大部分國家的股市都下跌。若本月底股市的表現還是沒有起色,這個月將成為過去50年來股市表現最差的一個月。
-美聯儲已經開始了市場預期的一系列升息動作的第一步 (去年12月升息)。
-全球許多貨幣兌美元正快速貶值。
In uncertain times like these, it is helpful to go back to market history to see if these events and fears are an indicator of things to come. For example:
在如此充滿不確定因素的時期,回看過去股市,有助於判斷類似的歷史事件或恐慌時期是否能作為預測股市未來的走向是有不少裨益的。舉個例子:
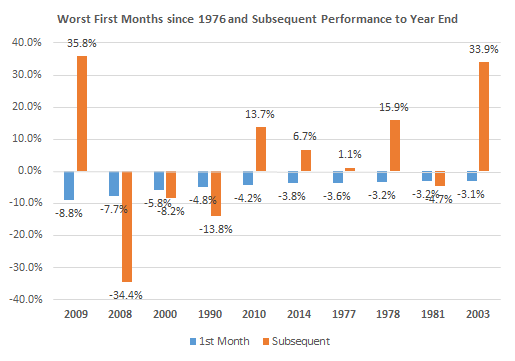
1) Historically, bad starts have not necessarily meant a bad year overall for the market.
In the past 40 years, the ten worst first months to the year for the MSCI World Index (stock markets of major countries around the world) have had an average subsequent performance of +4.6% for the rest of the year. Six of those ten months have had positive subsequent performances, listed in the chart below:
1)從歷史數據來看,對股市來講,壞的開端不一定代表一年的表現會很差:
過去40年,MSCI全球(全球主要股市)指數中一月表現最差的10個年度裡,其後 11個月的平均收益為4.6%,而這10年中的又有6個年度是盈利的,見下圖:
1976年以來最差首月及隨後月份的市場表現
2) World equities have done well in previous US rate hiking cycles
Rate hikes in the past have not meant sustained market declines. For example, from the start of the last rate hike cycle from the start of June 2004, world equities rose 11% by year end and 18 percent by the end of 2006. From the start of the rate hike cycle before that, in February 1994, world equities fell 3% by the end of the year, but had risen 15.3% by the end of 1996.
2) 過往美國升息週期全球股市都表現良好
在過去,升息也不意味著持續的市場下跌。舉個例子,從上一次升息週期至2004年6月初,全球股市至該年底上漲11%,至2006年底上漲18%。該輪升息的前一次升息週期的伊始,也就是1994年2月起,全球股市在該年底下跌3%,然而至1996年底收漲15.3%。
圖1:1994-96 升息及股市
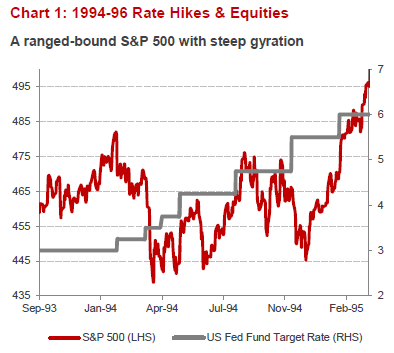
Source: Bank of Singapore
來源:新加坡銀行
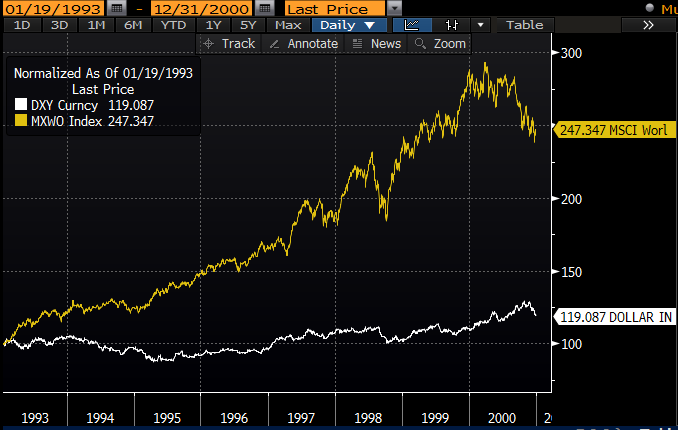
3) World equities have done well in periods of US dollar strength
There is a similar story for US dollar strength. After the start of that rate hiking cycle, the US dollar index went from a low of 81.5 on June 30, 1995 to close to 110 by the end of December 2000, and went as high as over 120 on January 2002. During that period, world stock markets were up 56.5% by December 2000, and were still up 24.6% at the end of January 2002.
3)全球股市在美元強勁時期表現良好
和股市一樣,美元在升息週期也具有類似表現。在1995年的升息週期開始後,美元指數從該年6月底81.5的低位至升值至2000年底的110,並在2002年一月升至120。在此期間,全球股市至2000年底上漲56.5%,至2002年1月底又上漲24.6%。
These historical comparisons are simple by design and easy to make. The aim is not to provide answers or context, but to dispel fears and premature reactions, particularly when one’s portfolio may be going down in value in the short term.
The next time the markets have you worried about your finances, it may be worthwhile to do the following:
1) ask yourself what in particular is the cause of your fears
2) see whether something similar has happened in the past
3) find out what has actually happened in the past to see if the fears are founded, or if you need more information before making decisions on your portfolio.
上述這些歷史數據是已簡易化的。我們作出上述比較並不是要提供一個答案,而是要消除恐懼以及對股市恐慌時作出過早反應,特別是當一個投資組合在短時間內下跌的時候。
若下次市場使你為自己的財務狀況擔憂的時候,也許做到以下這些能有些幫助:
1)問一下自己是什麼特別導致了你的恐慌
2)看一下在過去有否相似的事件發生過
3)尋找過去確實發生過的事件看一下是否有使人恐懼的根本,或是在對你的投資組合做任何決定前獲取更多信息
Mr. Cheng is a managing partner at Clarity Investment Partners, a Hong Kong based independent private investment office that directly manages personal accounts for families and institutions.
www.clarityinvestment.com
鄭先生為可承資本的董事合夥人。可承資本是一家總部設於香港,並專為高淨值家族及法人機構直接管理資產的獨立投資辦公室。
www.clarityinvestment.com/2002738913.html
● 讀後留言使用指南

|
近期迴響