|
| For a Better Tunghai |
|
| For a Better Tunghai |
How Much Does Asset Allocation Matter Anymore?
資產配置還重要嗎?
by Charles Cheng, CFA
鄭又銓, CFA
As we approach the ninth year of this global equity bull market and with bond yields still at extremely low levels, the effectiveness of traditional asset allocation would appear on the surface to be less useful than in the past. Or perhaps it could be less suited for the current environment. To help answer that question, we examine the past few years of asset returns during and before the current uptrend.
當我們進入全球股市牛市的第九個年頭,同時債券收益率仍處於極低水平時,傳統資產配置的有效性在表面上看起來似乎不如以往有用了。或者,也許是傳統資產配置對於當前的環境不太適合。為了幫助回答這個問題,我們研究了此輪上升期前及期間這幾年的資產回報。
Asset allocation is the one of the pillars of wealth and portfolio management. Traditionally, it has three main objectives: 1) Seeking sources of returns in different asset classes 2) Diversification and 3) Setting an investor’s risk return trade-off for various time horizons. Common asset classes used include Equities, Bonds, Commodities, and Real Estate with greater emphasis placed on the former categories. Equities and Bonds are often split further by allocators into various different classes of their own, such as international and emerging categories.
資產配置是財富及投資組合管理的支柱之一。傳統上,資產配置有三個主要目標:1)在不同資產類別內尋求回報來源 2)實現資產的多元化 3)在多種時間維度內設定投資者的風險回報權衡。普遍使用的資產類別包括股票、債券、大宗商品和房地產,而前兩種資產類別所佔投資比率最高。股票及債券通常被進一步分成各自不同的類別,如國際或新興類別。
Asset Class Total Returns from 7 Mar 2009 to Present
2009年3月7日至今不同資產類別的總收益
|
Asset Class |
Security Name |
Ticker |
Returns |
|
US Equities |
Vanguard Total Stock Market |
VTI |
341.0 |
|
European Equities |
Vanguard FTSE Europe |
VGK |
182.7 |
|
Asian Equities |
iShares MSCI All Country Asia |
AAXJ |
194.6 |
|
EM Equities |
Vanguard FTSE Emerging Markets |
VWO |
158.6 |
|
Real Estate |
Vanguard REIT |
VNQ |
461.8 |
|
USD Treasury |
iShares 7-10 Year Treasury Bonds |
IEF |
37.5 |
|
USD Corp Bonds |
iShares iBoxx $ Investment Grade |
LQD |
82.1 |
|
USD High Yield Bonds |
iShares iBoxx $ High Yield CorpAQ |
` |
151.5 |
|
EM Bonds |
iShares JP Morgan USD Emerging |
EMB |
119.7 |
|
Commodities |
iShares S&P GSCI Commodity Index |
GSG |
(42.2) |
Source: Bloomberg. Market Data as of 24- Jul –17.
來源:彭博,截至2017年7月24日的市場數據
We use ETF returns as proxies for the various asset classes. Recently, investment returns have been dominated by the stock markets. The current bull market is the second longest recorded since WWII. Since the market troughed in 2009, US equity markets have returned around 341%, European markets around 183% and Asian markets around 195%. US dollar REITS, real estate investment trusts listed on stock exchanges, have returned 462%. In contrast, Bond markets trailed far behind in performance, with US Treasuries returning around 38%, corporate bonds 82%, high yield bonds 152%, and emerging market bonds 120%. Commodities markets have lagged badly behind in performance losing around -42% of their value.
我們使用ETF的收益來代表不同資產類別的收益。目前,投資回報率由股市主宰。當前的牛市是二戰以來跨度第二長的一個。自從2009年市場陷入困境以來,美國股市總回報約341%,歐洲股市約183%,亞洲股市約195%。美元REITS,在證券交易所上市的房地產投資信託,總回報達462%。相比之下,債券市場的表現遠遠落後,美國國債回報僅約38%,企業債券82%,高收益債券152%,以及新興市場債券120%。大宗商品的表現則嚴重落後,其價值下跌約42%。
In hindsight the ideal asset allocation for the past eight years would have been mostly in equities. However, it is obvious that equities would lead the way during a bull market, which is defined by the period that equities are constantly rising, and no one can predict what the future will hold. Here are the returns from the onset of the global financial crisis, in Aug 08 to the bottom of the market in Mar 09:
事後看來,過去八年來最理想的資產配置應該是大部分配置在股票。然而,顯而易見的是,股票的表現在牛市一定是遙遙領先的,因為牛市的定義就是股票持續上漲的一段時期,而我們誰都無法預測未來市場的走向。以下是全球金融危機爆發前,2008年8月至市場達到最低點的2009年3月這段期間的表現:
|
Asset Class |
Name |
Ticker |
24-Aug-08 to 7-Mar-09 |
|
US Equities |
Vanguard Total Stock Market |
VTI |
(47.0) |
|
European Equities |
Vanguard FTSE Europe |
VGK |
(51.5) |
|
Asian Equities |
iShares MSCI All Country Asia |
AAXJ |
(43.1) |
|
EM Equities |
Vanguard FTSE Emerging Markets |
VWO |
(49.5) |
|
Real Estate |
Vanguard REIT |
VNQ |
(64.0) |
|
USD Treasury |
iShares 7-10 Year Treasury Bonds |
IEF |
8.8 |
|
USD Corp Bonds |
iShares iBoxx $ Investment Grade |
LQD |
(4.4) |
|
USD High Yield Bonds |
iShares iBoxx $ High Yield Corp |
HYG |
(28.2) |
|
EM Bonds |
iShares JP Morgan USD Emerging |
EMB |
(18.3) |
|
Commodities |
iShares S&P GSCI Commodity Index |
GSG |
(59.9) |
Source: Bloomberg. Market Data as of 24- Jul –17.
來源:彭博,2017年7月24日市場數據
Here, bonds show their value during a crisis, particularly high quality bonds, with US Treasuries returning around 9% and investment grade corporate bonds -4%, while various equity markets lost close to half their value in this short period. Bear in mind that stock market crises are extremely difficult to predict and that it would take a 100% return for a portfolio to come back to its initial level after a 50% loss.
在這段期間,債券體現出了它的價值,尤其是高質量的債券,當美國國債回報約6%及投資級企業債券回報3%時,各國股票市場在這個短短的時期都被腰斬。請記住,股市的危機極其難預測,而當你們的投資組合下跌50%後,需要以100%的回報來恢復至其下跌前的水平。
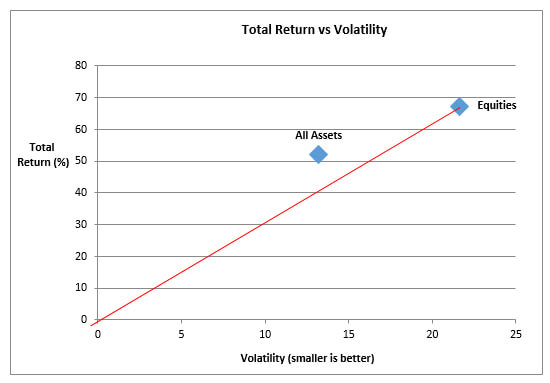
An aggressive asset allocator could try to maximize returns by trying to time when to go in and out of a risky asset like equities. However, for most people, without this capability, a mix of assets enables them to find a preferred risk- return trade-off. To examine this tradeoff we have to look at market risk as well as return. To compare return with volatility we compare the investment universe of equity-only asset classes versus a combination of all popular asset classes, and examine the full period of returns from August 2008 to present day. For simplicity sake, we assumed equal weighted portfolios rebalanced monthly:
一個激進的資產配置者可以嘗試通過試著找出如股票這類高風險資產的最佳進場及退場時機來最大化其回報。然而,對於大部分沒有這種能力的投資者來講,混合不同的資產類別能使其獲得更佳的風險回報權衡點。為了檢驗該權衡點,我們必須看一下市場風險及回報。為了比較一定波動值下的收益率,我們對投資領域內的純股票資產類別與把所有熱門的資產類別混合的投資組合加以比較,並且研究從2008年8月至今整段時期的收益。為了簡單起見,我們假設該投資組合內各資產類別的比重相等,而每月都重新調整其比重至初始值:
Source: Bloomberg. Market Data as of 24- Jul –17.
來源:彭博,2017年7月24日市場數據
While equities had a higher return overall, around 67% vs 52%, the mix of assets in the combined portfolio mitigated the volatility, even despite including the poorly performing commodity asset class and despite bond yields near historical lows throughout the period. The Sharpe Ratio is a commonly used measure of return per unit of volatility, and for the combined portfolio the ratio was 3.2 compared to 3.0 for the equity portfolio. The red line above represents the risk return tradeoff scenario of the equity portfolio combined with a percentage of cash (zero return, zero volatility).
雖然純股票組合整體回報較高,約為67%對52%,然而不同資產類別的混合減輕了多資產投資組合的波動性,儘管該組合中包含了在該段時期表現差強人意的大宗商品以及回報接近歷史最低值的債券。夏普比率(Sharpe Ratio)通常被用來衡量單位波動值的收益率。對於混合各種資產類別的投資組合,其夏普比率為3.2,而純股票組合為3.0。上圖中的紅線代表了股票組合混合一定比例的現金(零回報、零風險)後的風險收益權衡情境。
A perhaps better measure of risk is the drawdown, the magnitude that a portfolio drops over a certain period. Even during the bull market period following the trough of the market in 2008, a simple mix of assets was able to significantly mitigate the degree that portfolios fell during times of market turmoil:
或許一個更好的衡量風險的標準是一段時期內投資組合下跌的幅度。即使在2008年市場低谷之後的牛市時期,一個簡單的多資產混合配置也能夠大大減輕該投資組合在市場動盪期間下跌的程度。
|
Max % Drawdown during: |
Equities |
All Assets |
|
2010 Flash Crash / Job Fears / Euro Downgrades |
(16.5) |
(9.7) |
|
2011 Euro Debt Crisis |
(27.6) |
(15.4) |
|
2012 Greek Elections |
(14.4) |
(8.0) |
|
2015 Greek Debt Crisis/ China Stock crash |
(25.1) |
(17.4) |
|
Average Post Financial Crisis Drawdown |
(20.9) |
(12.6) |
Source: Bloomberg. Market Data as of 24- Jul –17.
來源:彭博,2017年7月24日市場數據
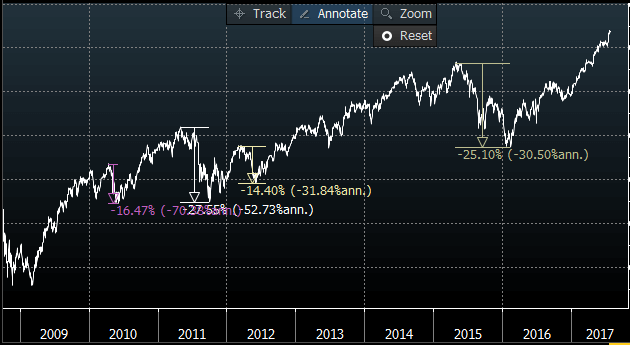
All Equity Portfolio Drawdowns
純股票投資組合的下跌幅度
Source: Bloomberg. Market Data as of 24- Jul –17.
來源:彭博,2017年7月24日市場數據
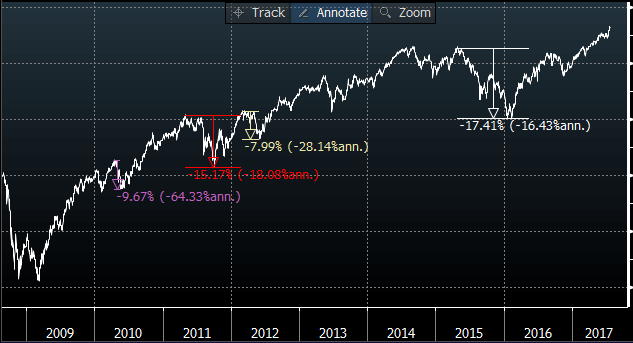
All Asset Portfolio Drawdowns
多資產投資組合的下跌幅度
Source: Bloomberg. Market Data as of 24- Jul –17.
來源:彭博,2017年7月24日市場數據
A better return / risk tradeoff in a mixed asset strategy may enable investors to improve their investment returns despite using lower total return assets. This is because few investors actually put the entirety of their liquid wealth into financial markets and therefore could use more of their cash assets to increase the size of the investments that they are taking on. If they are able to invest, say, 30-50% more into a mixed asset portfolio than a straight equity portfolio while remaining within their tolerable level of risk, then their achievable returns would likely be higher overall even during a favorable period for stocks. For most investors, investing in a broader range of assets can still be a major benefit, regardless of the market environment.
在一個多資產混合的投資策略中選擇較好的收益/風險權衡值也許會讓投資者獲得更佳的投資收益,即使他使用了總收益較低的資產類別。這是因為很少有投資者確實將其全部流動資產投入金融市場,因此可以利用更多的現金資產來增加投資的規模。如果這些投資者能夠多投入30%-50%的資產於一個混合資產的投資組合而不是純股票組合中,同時將風險保持在其可忍受的風險水平內,那麼總體來講,他們的可實現收益即使在股票表現較好的時期也會比純股票投資組合更高。對於大多數投資者來說,無論市場環境如何,將資產分佈於更廣泛的投資類別仍然是非常有益的。
Mr. Cheng is a managing partner at a Hong Kong based independent private investment office that directly manages personal accounts for families and institutions.
鄭先生為可承資本的董事合夥人。可承資本是一家總部設於香港,並專為高淨值家族及法人機構直接管理資產的獨立投資辦公室。
● 讀後留言使用指南

|
近期迴響